Web traffic
Who visits your pages – without addresses leaving the server.
The agent reads the access log of Apache or nginx and counts on your server: page views, visits, errors and who is coming – people, search engines, AI crawlers or attackers. Only totals per minute and page go to Lynx. You switch the analysis on per server, yourself.
The essentials
Totals only
No IP address, not even as a hash, no user agent and no single request leaves the server.
Off until you want it
The owner switches the analysis on per server – after an explanation of what that means.
People and bots apart
Five classes, recognised by name and by behaviour.
01
What you see
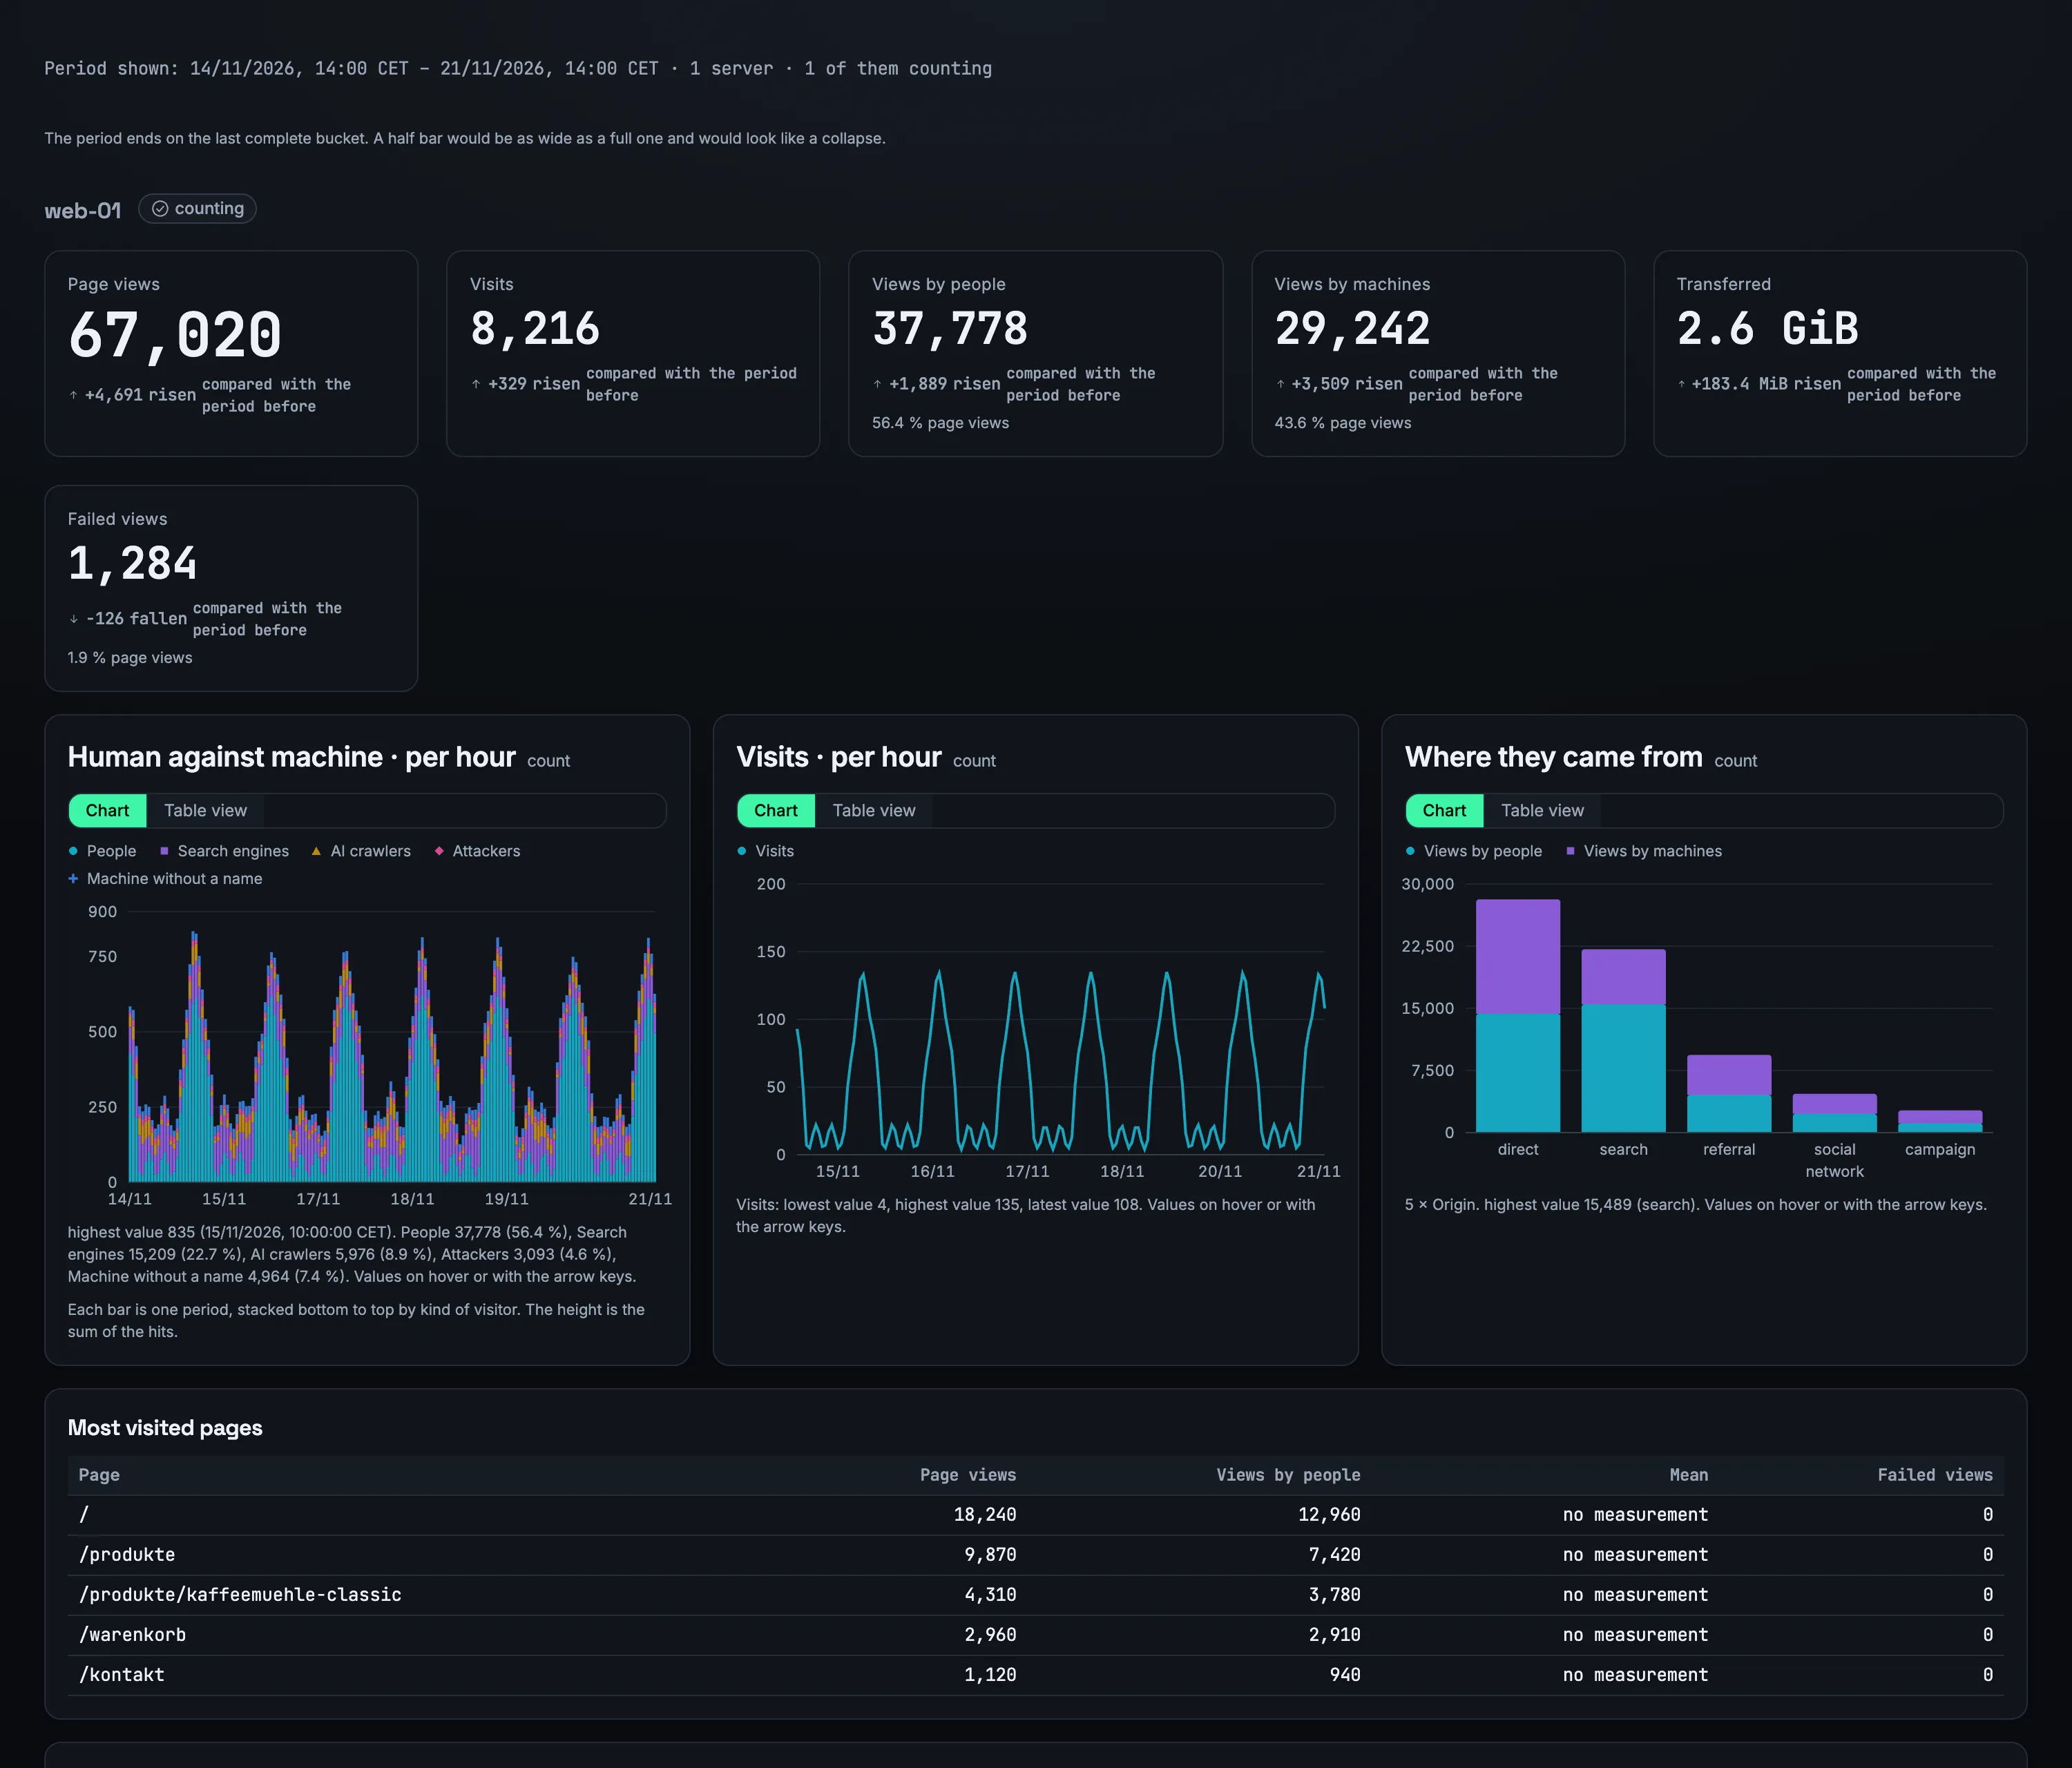
Six figures compared with the previous period: page views, visits, requests by people, requests by bots, data sent and errors.
Below that a chart showing people and bots stacked, the trend of visits and where visitors come from. You choose the resolution: hour, day or week.
Visits are an estimate: for them the agent builds a checksum from a random value that changes daily, the address and the user agent – and this checksum stays on the server.
- the most visited pages
- pages with errors, with the page visitors came from
- downloads
- pages fetched by search engines
- where visitors come from: direct, search, other websites, social networks, campaigns
02
What leaves the server – and what does not
The analysis happens on your server. For every minute and page, one line of figures goes to Lynx.
That line carries the page's path without the query string, the kind of referrer, the kind of device, the class of visitor, the number of requests and visits, the bytes sent and the number of responses by status code.
Never included are a visitor's IP address, not even as a hash, their user agent, their location or a single request. A check in the code fails as soon as such a field appears.
Per-minute values are kept for 90 days, then hourly values; nothing is kept longer than 730 days. Lynx processes the figures as a processor under the data processing agreement.
- no IP addresses, not even as a hash
- no user agents
- no single requests
- no query strings
03
People and bots
A large share of the requests to a website does not come from people. Lynx splits them into five classes.
First by the name a bot gives, then by behaviour: anyone making more than 120 requests in a minute, fetching six pages without a single image or stylesheet, arriving as twelve visitors from the same network or producing almost nothing but errors no longer counts as a person.
Lynx uses the same verdict to spot a flood of requests from single addresses or bots.
People
visitors with a browser
Search engines
the known crawlers of search services
AI crawlers
crawlers collecting for AI services
Attackers
requests probing for weaknesses
Unknown bots
everything that behaves like a bot
04
Switched on by you, per server
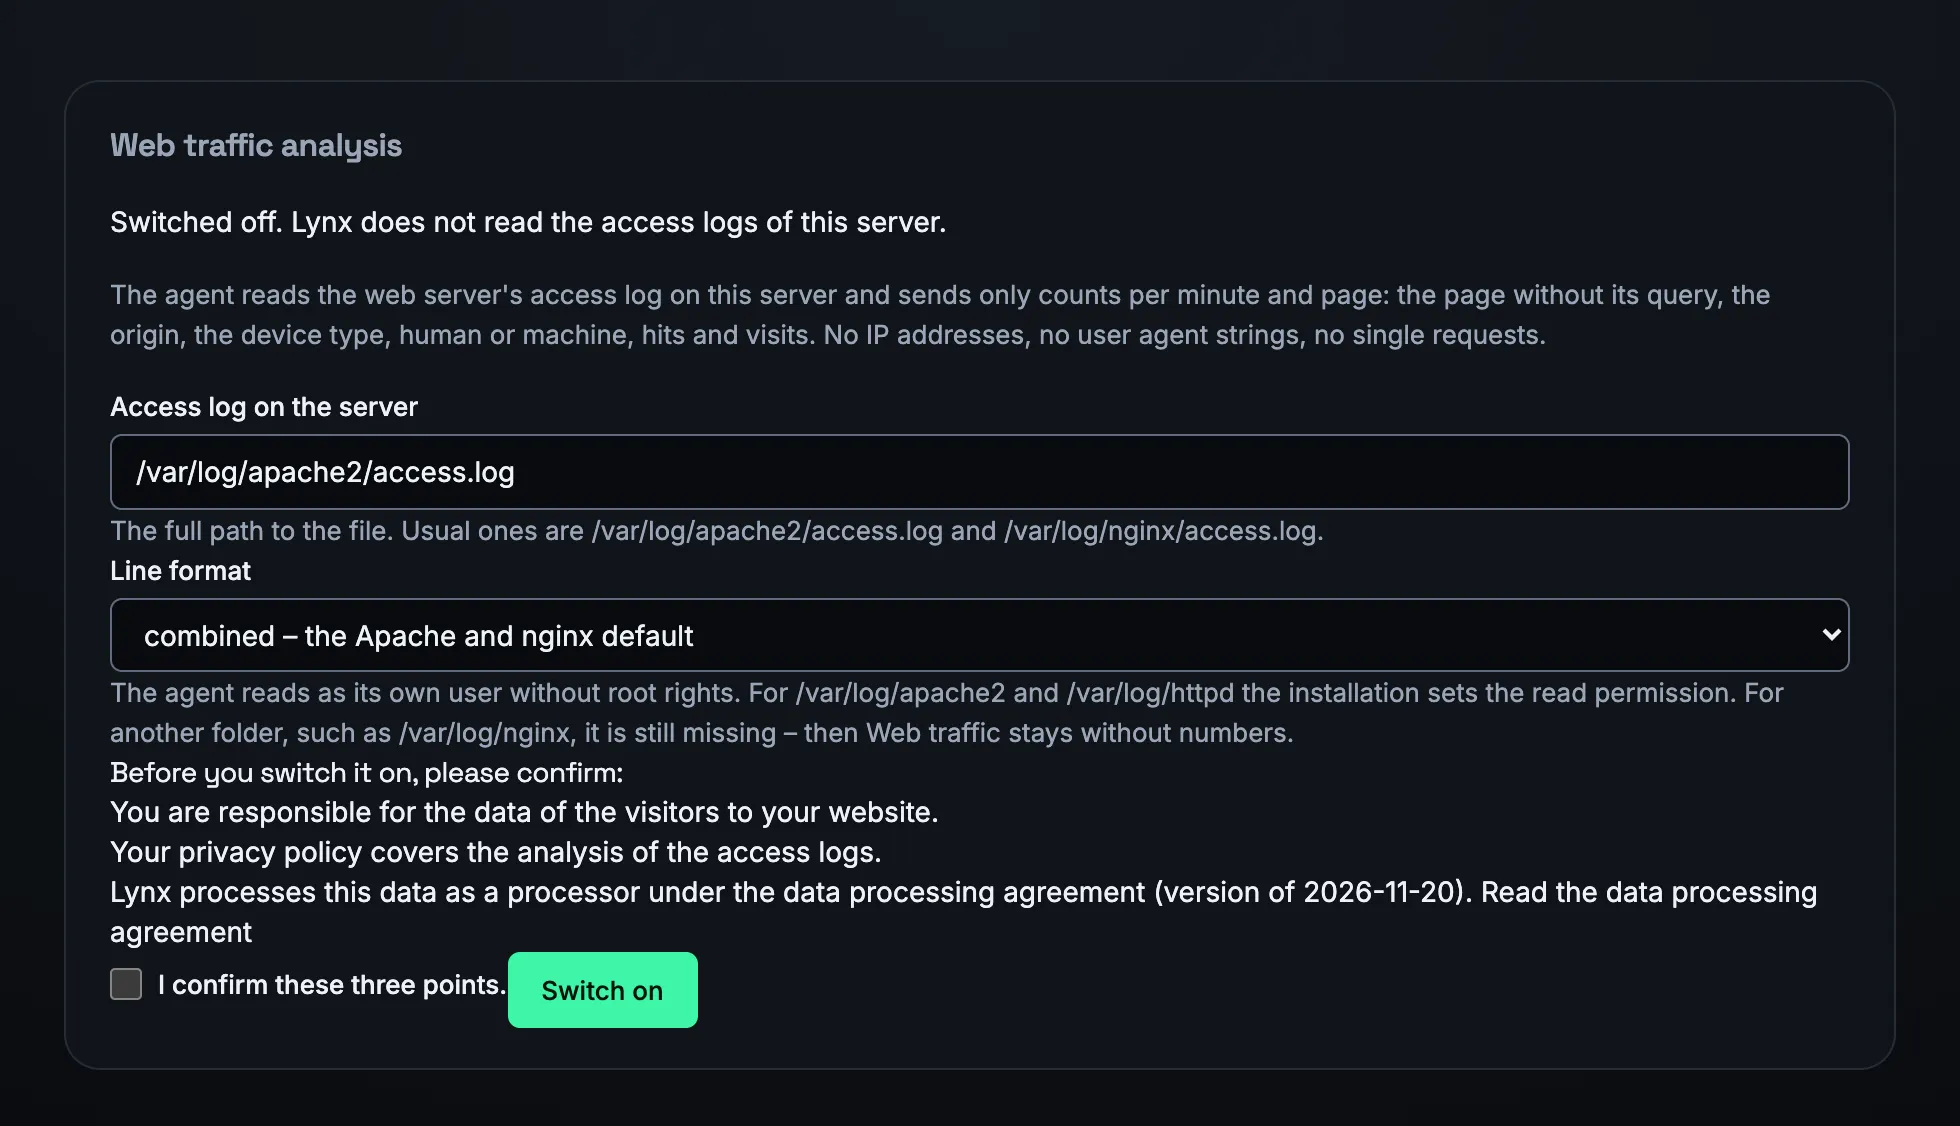
The analysis is off until the account owner switches it on for a server.
To do so you name the log file and its format and confirm with a tick under three sentences: you are responsible for your visitors' data, your privacy policy covers the analysis, and Lynx processes it as a processor under the data processing agreement.
Without that confirmation the analysis cannot be switched on – the database itself enforces this, not just the interface.
You can switch it off at any time, and delete the counted data straight away if you wish; the agent then also deletes its state on the server. Only the owner can switch it on and off and view the analysis.
05
Requirements
The analysis reads the access log of Apache or nginx in the formats combined, combined with response time or vhost_combined.
The installer gives the agent read access to the logs in /var/log/apache2, /var/log/httpd and /var/log/nginx. On an nginx server whose agent was installed before 21 November 2026, re-install it once – then the read access for nginx is there too.
Response times per page and the list of the slowest pages are only available with the format combined with response time; with combined and vhost_combined they stay empty.
Frequently asked questions
Do my visitors' IP addresses go to Lynx?
No. The analysis happens on your server; only totals per minute and page go to Lynx – no IP address, not even as a hash, no user agent and no single request.
Does it work with nginx?
Yes. nginx writes its access log in the combined format by default, and the installer gives the agent read access to /var/log/nginx. Was the agent installed before 21 November 2026? Then re-install it once.
Who can switch the analysis on?
Only the account owner, per server, and only after confirming the three sentences on responsibility, privacy policy and data processing. Only the owner can view the analysis, too.
How long are the figures kept?
Per-minute values for 90 days, then hourly values, for at most 730 days in total. When you switch it off, you can have the counted data deleted straight away.
Does this replace a web analytics tool?
It answers the questions of operations: how busy it is, how much of it is bots, which pages return errors. It does not show entry and exit pages, search terms or visits across several days.
More features
See who really visits.
Install the agent, switch it on for a server – from then on the agent counts every minute.