Server monitoring
Every server, every minute – seen from inside.
A small agent on your Linux server measures how it is doing every minute: CPU, load, memory, disks, network, services and the largest processes. Lynx turns this into charts, checks, a forecast for full disks and alerts that only speak up when it matters.
The essentials
Every minute
Metrics every minute, kept per minute for 30 days and as hourly values for 400 days.
No root, no open port
The agent runs as its own user and only opens one outgoing HTTPS connection.
Names only, never command lines
For processes the agent sends the name – never the command line, the environment or the user.
01
Metrics every minute
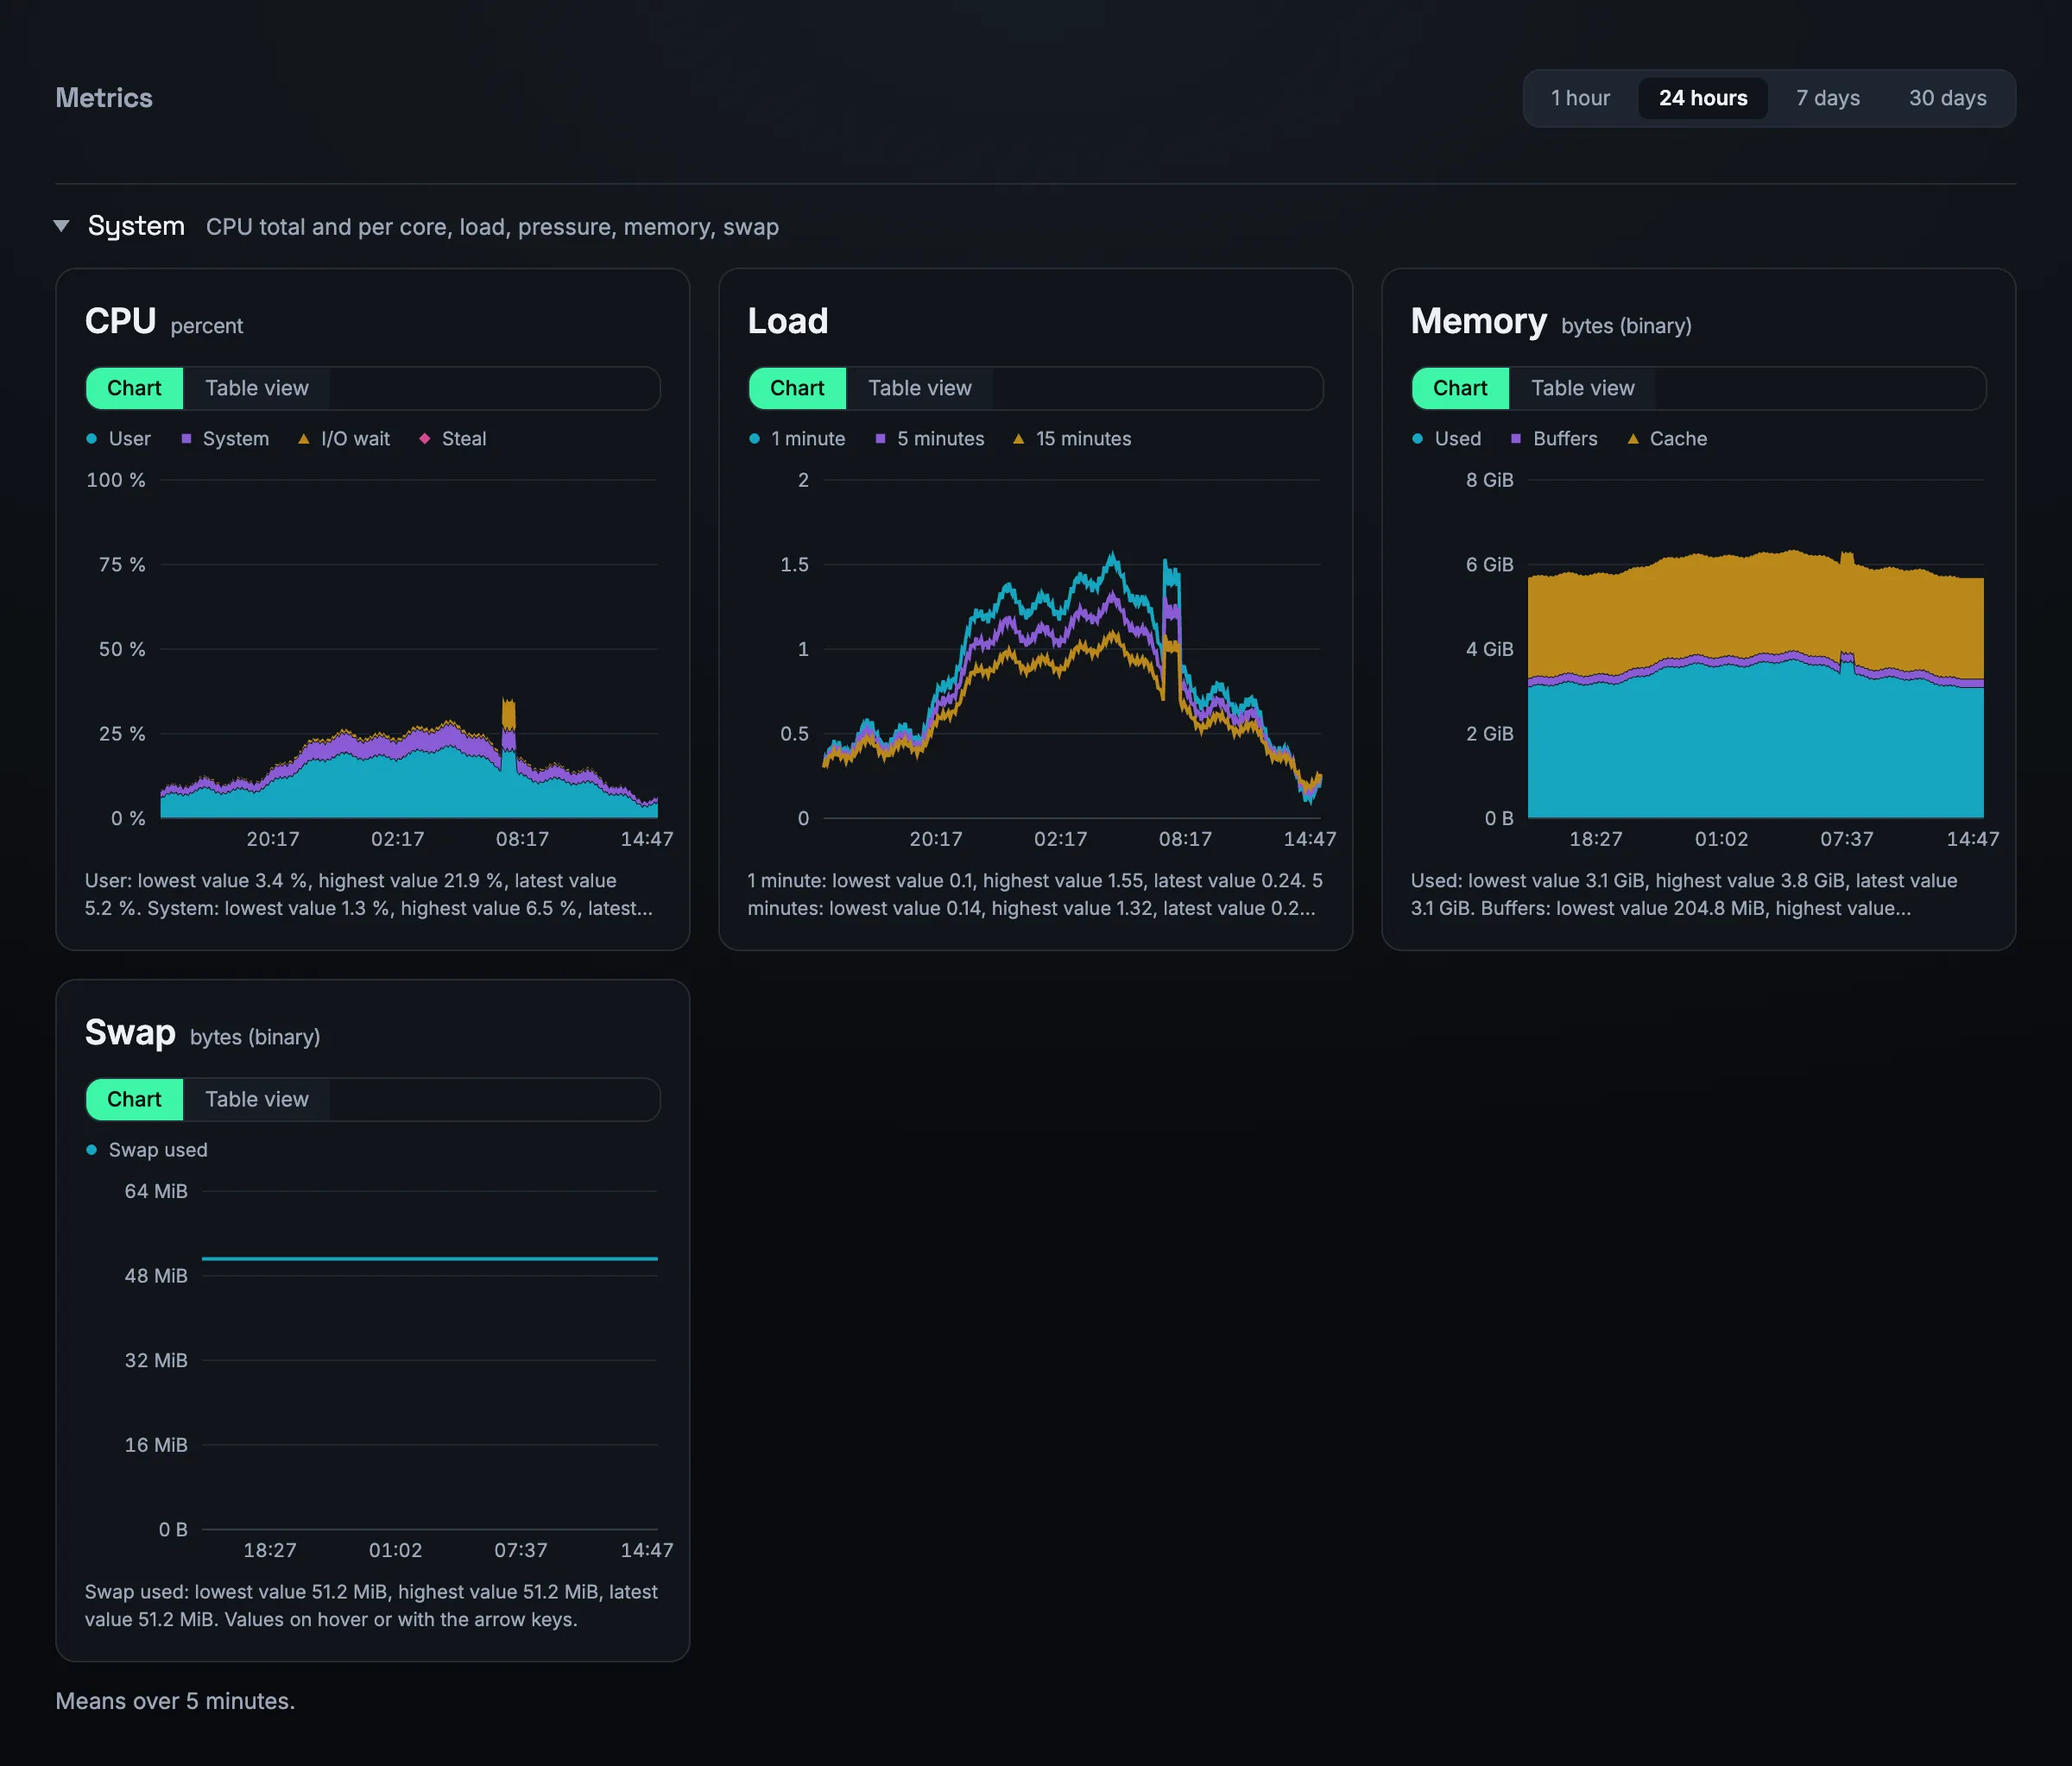
CPU, load, memory and swap, disk throughput and utilisation, network, usage and inodes of every file system – once a minute, as charts over one hour, 24 hours, seven or 30 days.
CPU is split into user, system, iowait and steal, and can be shown per core as a heat map. Where the kernel offers it, the agent measures pressure on CPU, memory and I/O (PSI) and open sockets. Every disk has read and write rates, utilisation and wait time.
If MySQL, PHP-FPM or Apache is running, their series are added: queries and slow queries, connections and reads from memory; active, idle and queued PHP-FPM processes per pool; requests per second and busy Apache workers.
If the connection drops, the agent keeps the measurements for up to 24 hours and delivers them afterwards – the gap in the chart closes by itself.
02
Services and bottlenecks
Checks from inside that know what a web server looks like just before it struggles.
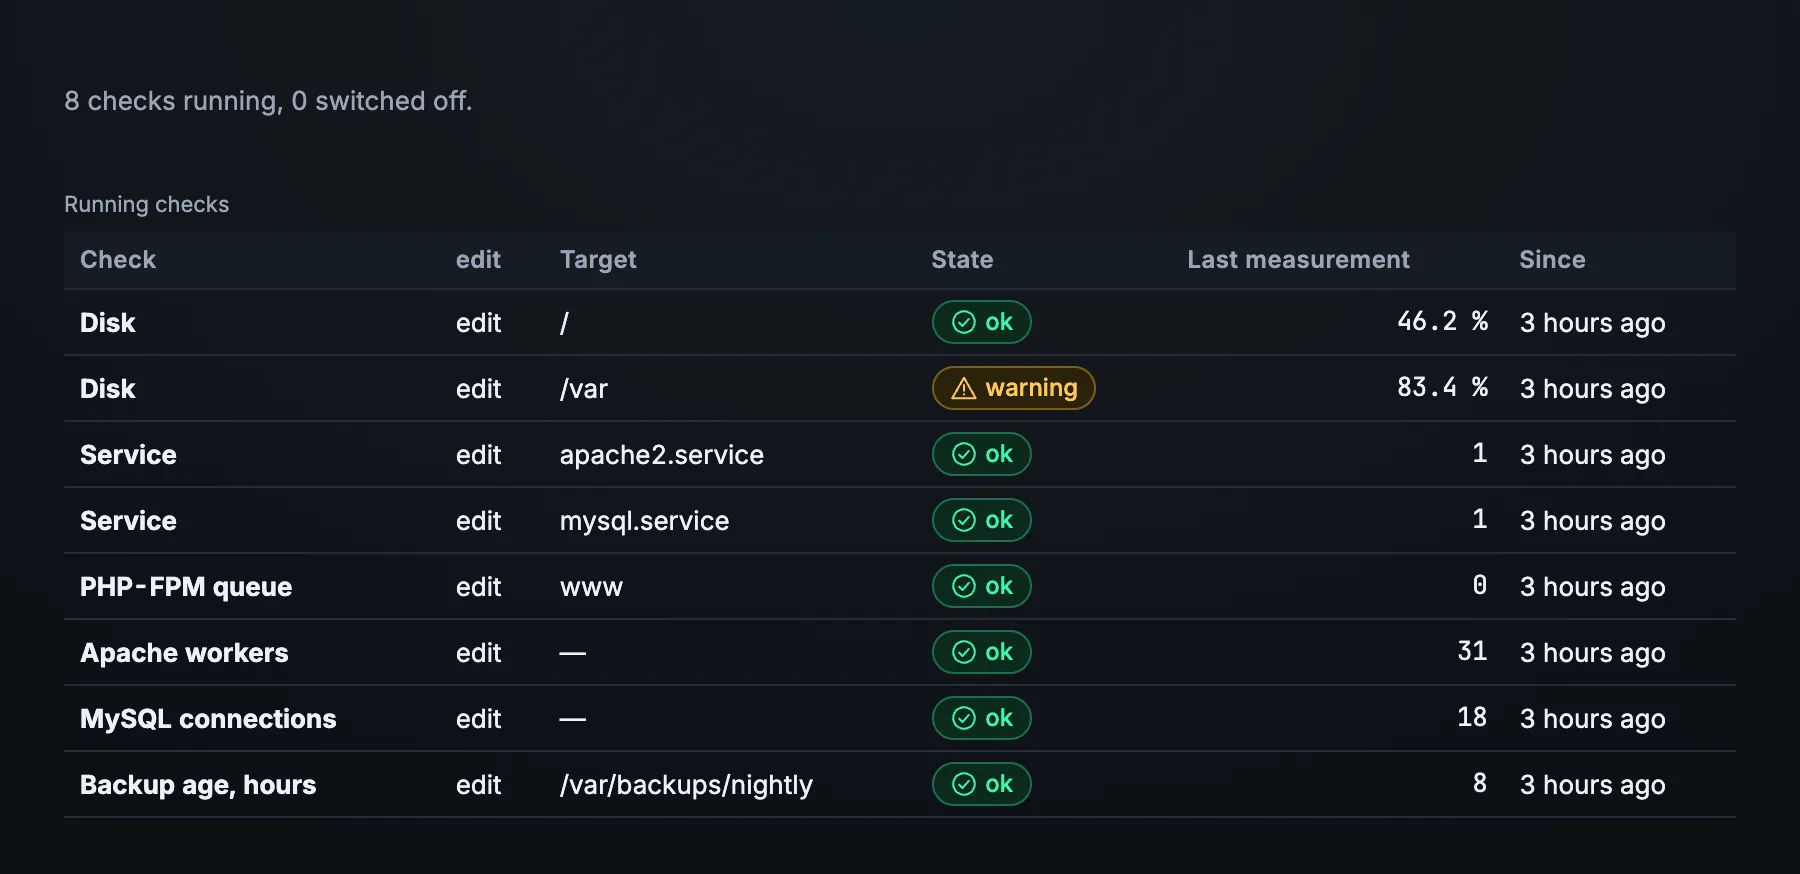
Lynx checks that the important services are running – ssh, cron, Apache or nginx, PHP-FPM, MySQL or MariaDB, Redis – and looks at the places where a server runs short first. Every check has warning and critical thresholds that you can change per server.
During installation the installer looks at what runs on the server, and Lynx switches on the matching checks. For MySQL the agent needs its own account with no password and no rights on the data; the installer shows the command for it.
Apache
busy workers: warning from 75 %, critical from 90 %
PHP-FPM
queued requests and the process limit reached, per pool
MySQL
connection usage, refused connections, slow queries
Backups and logs
age of the last backup, error rate and new fatal errors in the log
03
The largest processes
“Which process was on top at 03:10?” is the first question after every load spike. Lynx answers it.
Every minute the agent records the ten processes using the most CPU and the ten using the most memory – with name, PID, CPU, memory and threads – and groups all processes: web server, PHP, database, mail, backup and others. The snapshots are kept for five days.
Only the name the kernel keeps is sent. The agent does not even read a process's command line, environment or user: a command line too often contains a password.
04
Disk full soon
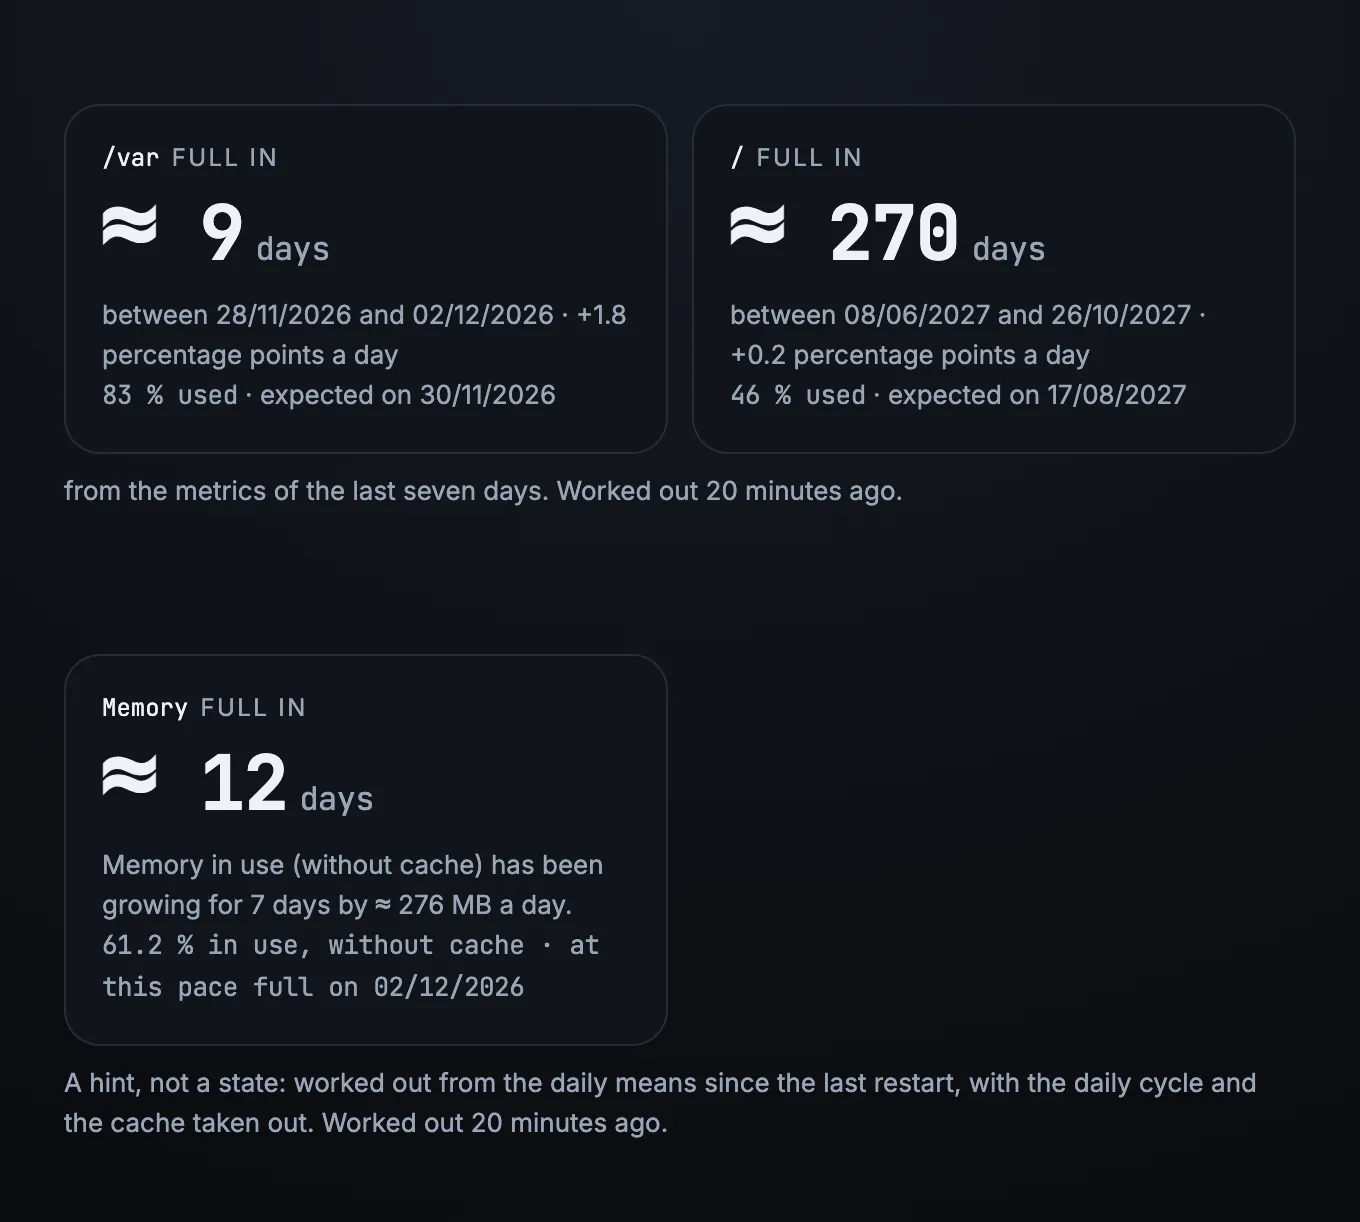
“Full in about nine days” – Lynx reads the trend so you can act during working hours, not at night.
Every hour Lynx fits a trend line through the last seven days of hourly values of every file system. The method ignores outliers: a single large upload triggers no warning, and a disk that only holds data at rest stays quiet.
A warning is only raised when the trend is clear and holds for two runs in a row. In the server list a server gets a badge as soon as a disk would be full in less than 14 days.
Disk
warning under 7 days until full, serious under 2 days
Inodes
the limit that many small files hit first
Memory
steady growth, switched on if you want it
05
Metric alerts
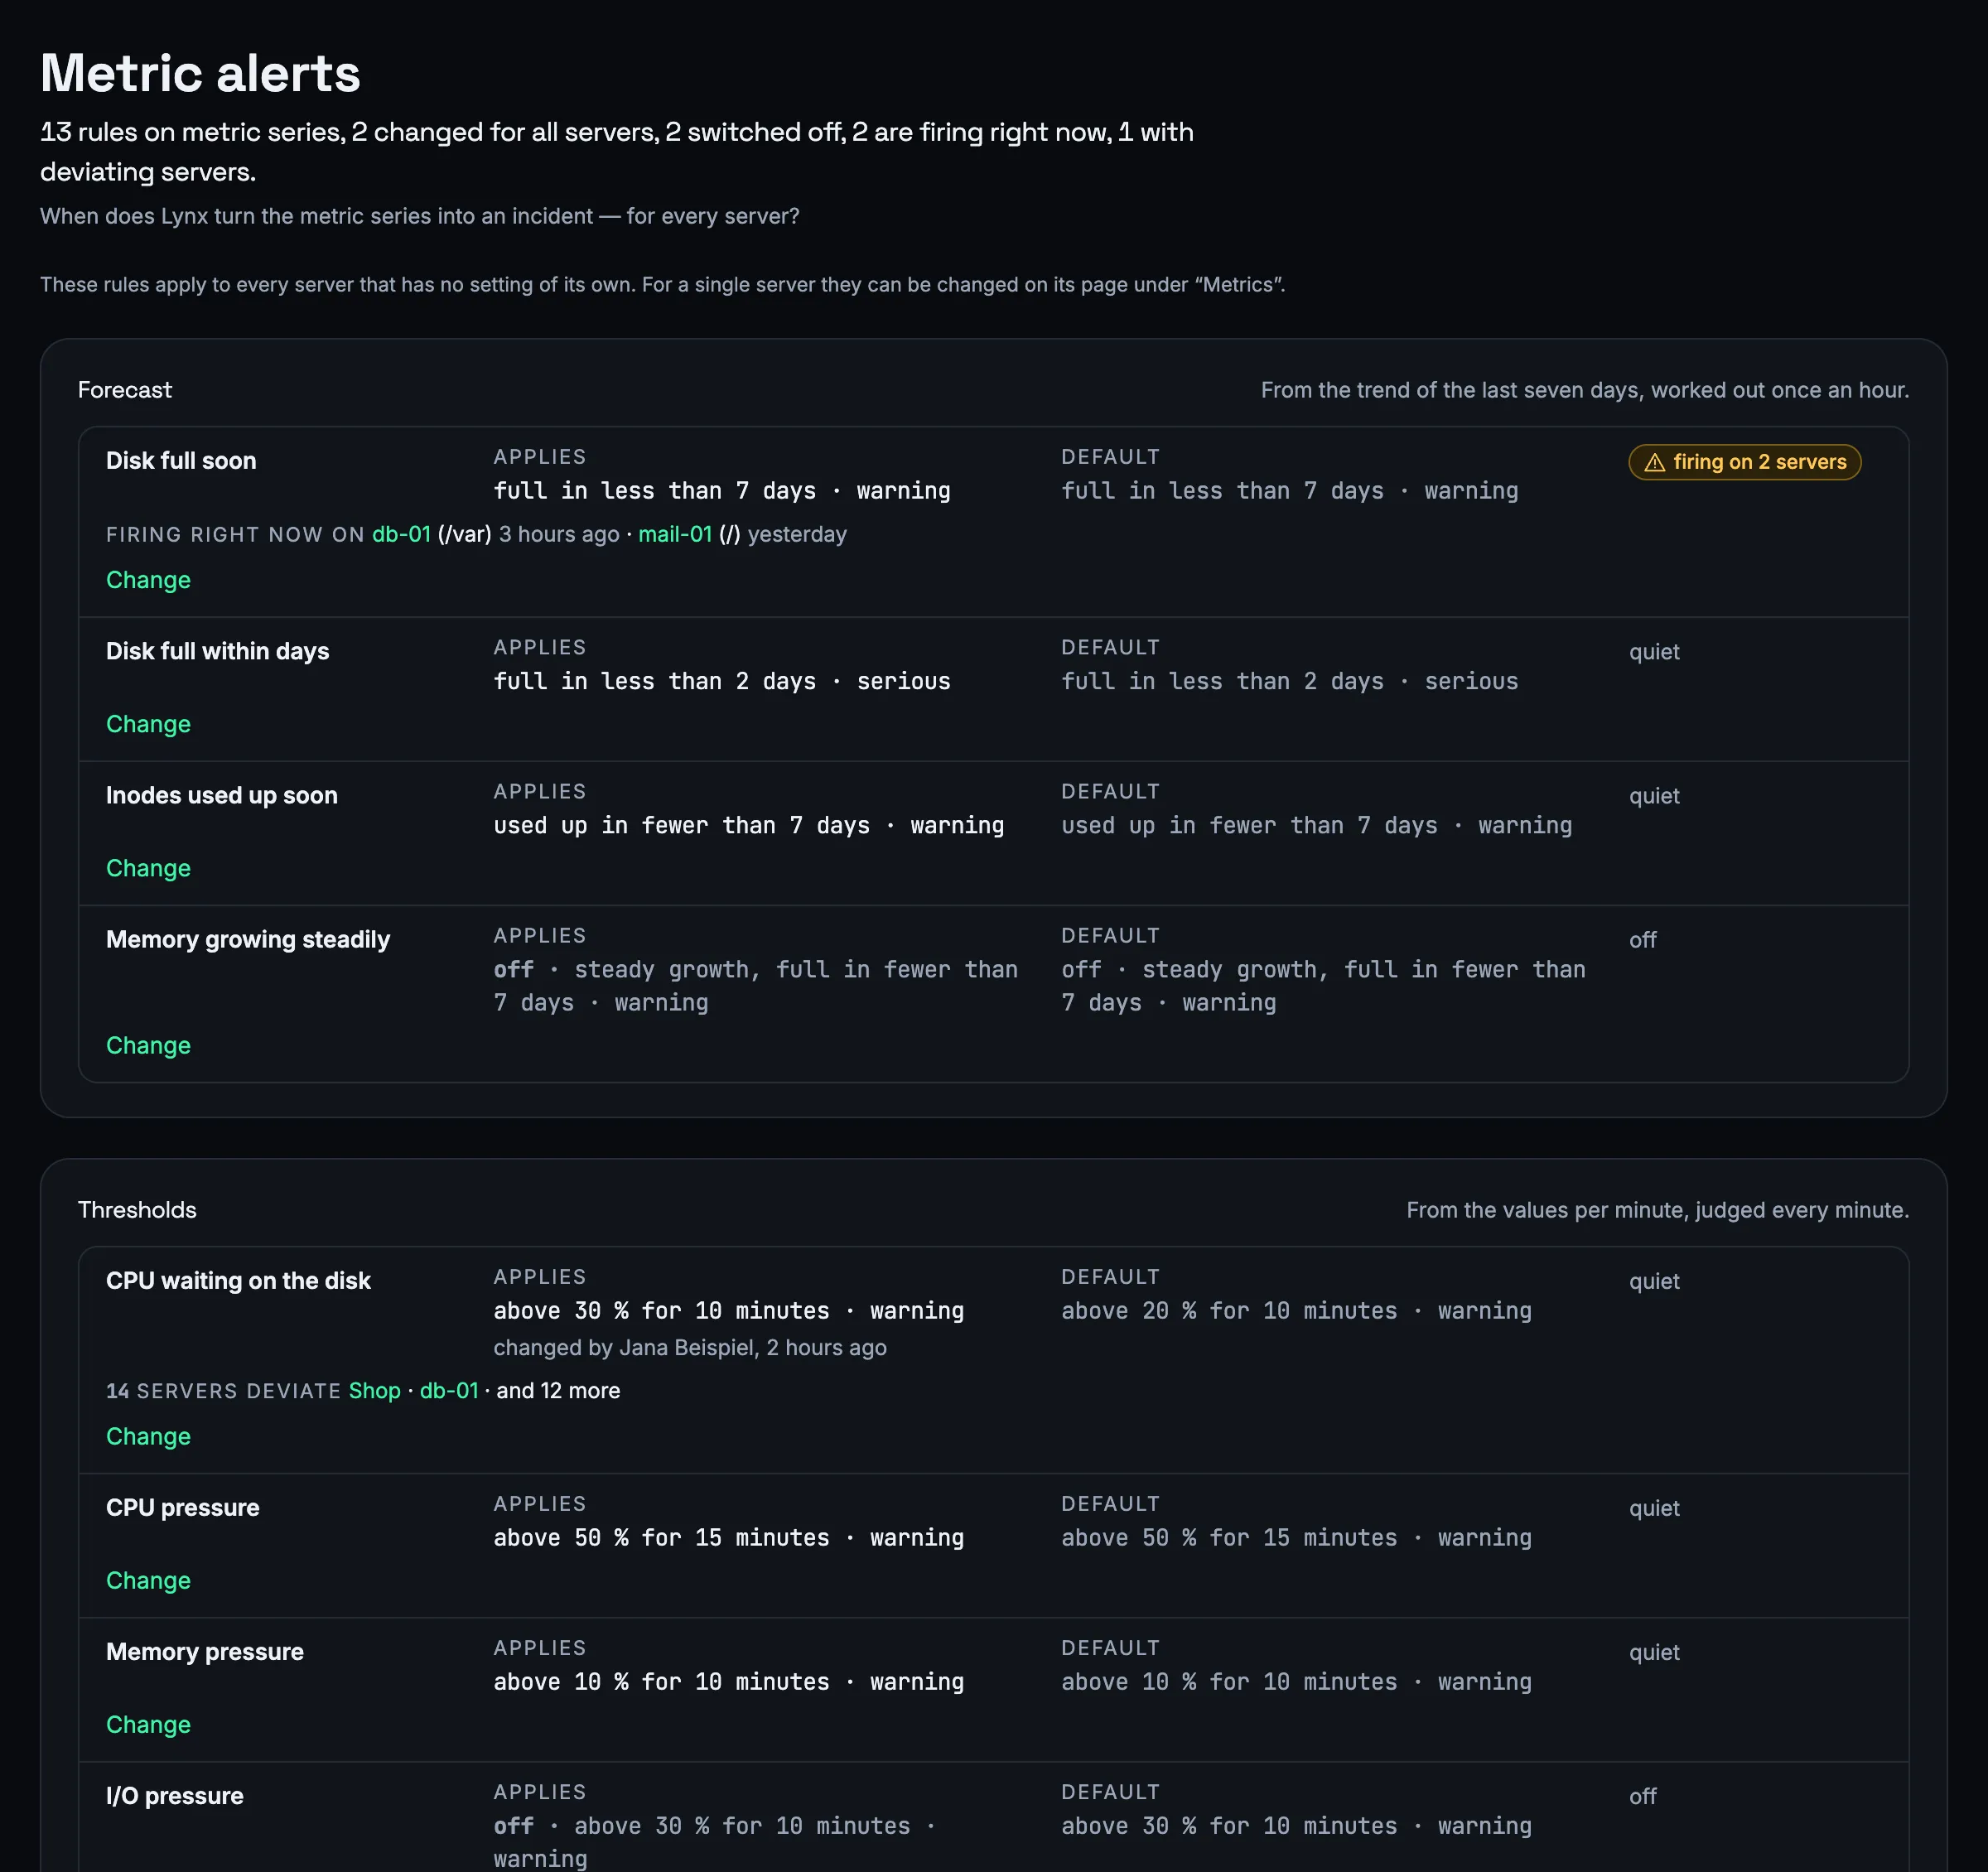
Thresholds on the metrics themselves: Lynx alerts when a value stays too high or too low for a while – not on a single spike.
Nine rules are ready out of the box, all as warnings: for example I/O wait above 20 % for ten minutes, less than 10 % free memory for ten minutes, a disk more than 90 % busy for 15 minutes, queued PHP-FPM requests or lock waits in MySQL.
Every rule can be changed for the whole account or a single server: on or off, threshold, a duration from one to 60 minutes and severity. Owners and technicians edit, readers view; every change goes into the change log.
06
System information
What is on the server, not just how it is doing – refreshed every five minutes.
For every server Lynx shows the operating system, kernel, CPU model, memory and uptime, file systems and network addresses, systemd services and their restarts, certificates with their days left and the number of failed SSH logins in the last hour.
Once a night the agent also builds a list of the installed software: packages, kernel, OpenSSL, web server, database, PHP with its modules and WordPress or Shopware 6 in the web root. The check against known vulnerabilities is based on this list.
- pending updates, and how many of them are security updates
- “reboot required” after a kernel update
- open ports with process and user account, and which are open from outside
- failed systemd services
- certificates on the server and their days left
- failed SSH logins – counted only, without addresses
07
The agent
A single program with no dependencies, for Ubuntu 20.04 to 26.04 on amd64 and arm64, installed with one command.
It runs as its own user without special rights and refuses to start as root. It opens no port and only talks to Lynx outbound over HTTPS on port 443. The target is less than 1 % of one core and at most 64 MB of memory; systemd enforces a hard limit above that.
If an agent sends no data for ten minutes, that becomes an incident of its own – and if the outside check cannot see the server either, it is called “server unreachable”. If a single check stops delivering values, Lynx reports that too instead of quietly showing green.
Agent updates are signed, rolled out in stages and fall back to the previous version by themselves if something goes wrong.
Frequently asked questions
Which servers does the agent run on?
On Ubuntu 20.04, 22.04, 24.04 and 26.04 with systemd, on amd64 and arm64. The installer refuses other distributions on purpose, because nobody has tested them. Lynx checks websites and services from outside regardless of what they run on.
How much load does the agent cause?
The target is less than 1 % of one core and at most 64 MB of memory. systemd also caps the agent hard at a quarter of one core and 64 MB, and it runs with low priority for CPU and disk.
What does the agent send – and what never?
It sends measurements, system information, the list of installed packages, process names and open ports with process and user account. It never sends file contents, command lines or environment variables; from log files only counts leave the server, no lines and no visitor addresses.
What happens if the connection drops?
The agent keeps measuring and holds the values on disk for up to 24 hours. Once the connection is back, it delivers them. If it sends nothing at all for ten minutes, Lynx opens an incident.
Can I change the thresholds?
Yes. Checks have warning and critical thresholds per server, and metric alerts can be adjusted for the whole account or a single server – threshold, duration and severity. Every change goes into the change log.
More features
See your first server in Lynx.
One command on the server, and its metrics appear within minutes.